The Wrong Villain: Why Everything You've Been Told About the Children's Mental Health Crisis Is Pointing at the Wrong Cause.
What I built, why I built it, and what 54 years of data actually shows about the children's mental health crisis

I want to tell you about something I’ve spent the last few months building.
Not because I think I’ve solved anything. But because I’ve been sitting with a specific frustration for long enough that I needed to do something more concrete than write about it.
The frustration is this: the conversation about children’s mental health the one happening in Parliament, in staff rooms, in GP surgeries, in the press is not aimed at what the evidence shows is driving it. And that mismatch has a cost. When you treat the wrong thing, the right thing goes untreated. And the children who need the most help continue to wait.
So I built a data tool.
What it is
The Wrong Villain is a free interactive visualisation running from 1971 to 2025. Six bars move left to right through 54 years of UK history. Child mental health disorder prevalence. Child poverty rate. UK unemployment as a family stress proxy. CAMHS waiting times. Adverse childhood experience exposure risk. Real-terms service spending on child mental health.
Every data point comes from a primary government source or a peer-reviewed journal. NHS Digital’s Mental Health of Children and Young People surveys from 2017 to 2023. The Institute for Fiscal Studies poverty data series going back to 1961. ONS and OECD unemployment figures from 1971. The Children’s Commissioner’s annual mental health briefing. The Avon Longitudinal Study on adverse childhood experiences. The British Journal of Psychiatry. No opinion anywhere. Just what the numbers show when you put them together and watch them move.
At 13 major world events a speech bubble appears above the bars explaining what happened and why the data responds the way it does. The 1973 oil crisis. Thatcher’s election and the welfare restructuring that followed. The 1982 unemployment peak. The Blair poverty reduction programme the most important moment in the dataset, and the one almost nobody talks about. The 2008 financial crash. The start of austerity in 2010. Smartphone mass adoption in 2012. Brexit. COVID. The cost of living crisis.
You can run it at normal speed and watch 54 years in about a minute. Or slow it right down and read every event card. Or drag the scrubber to any specific year and sit with what the bars are showing at that moment.
The thing I keep coming back to
Before I get into what the tool shows about social media and it does address that directly, with three separate phases including the Haidt overlay and a proper kickback section I want to describe the moment in the data that I think matters most.
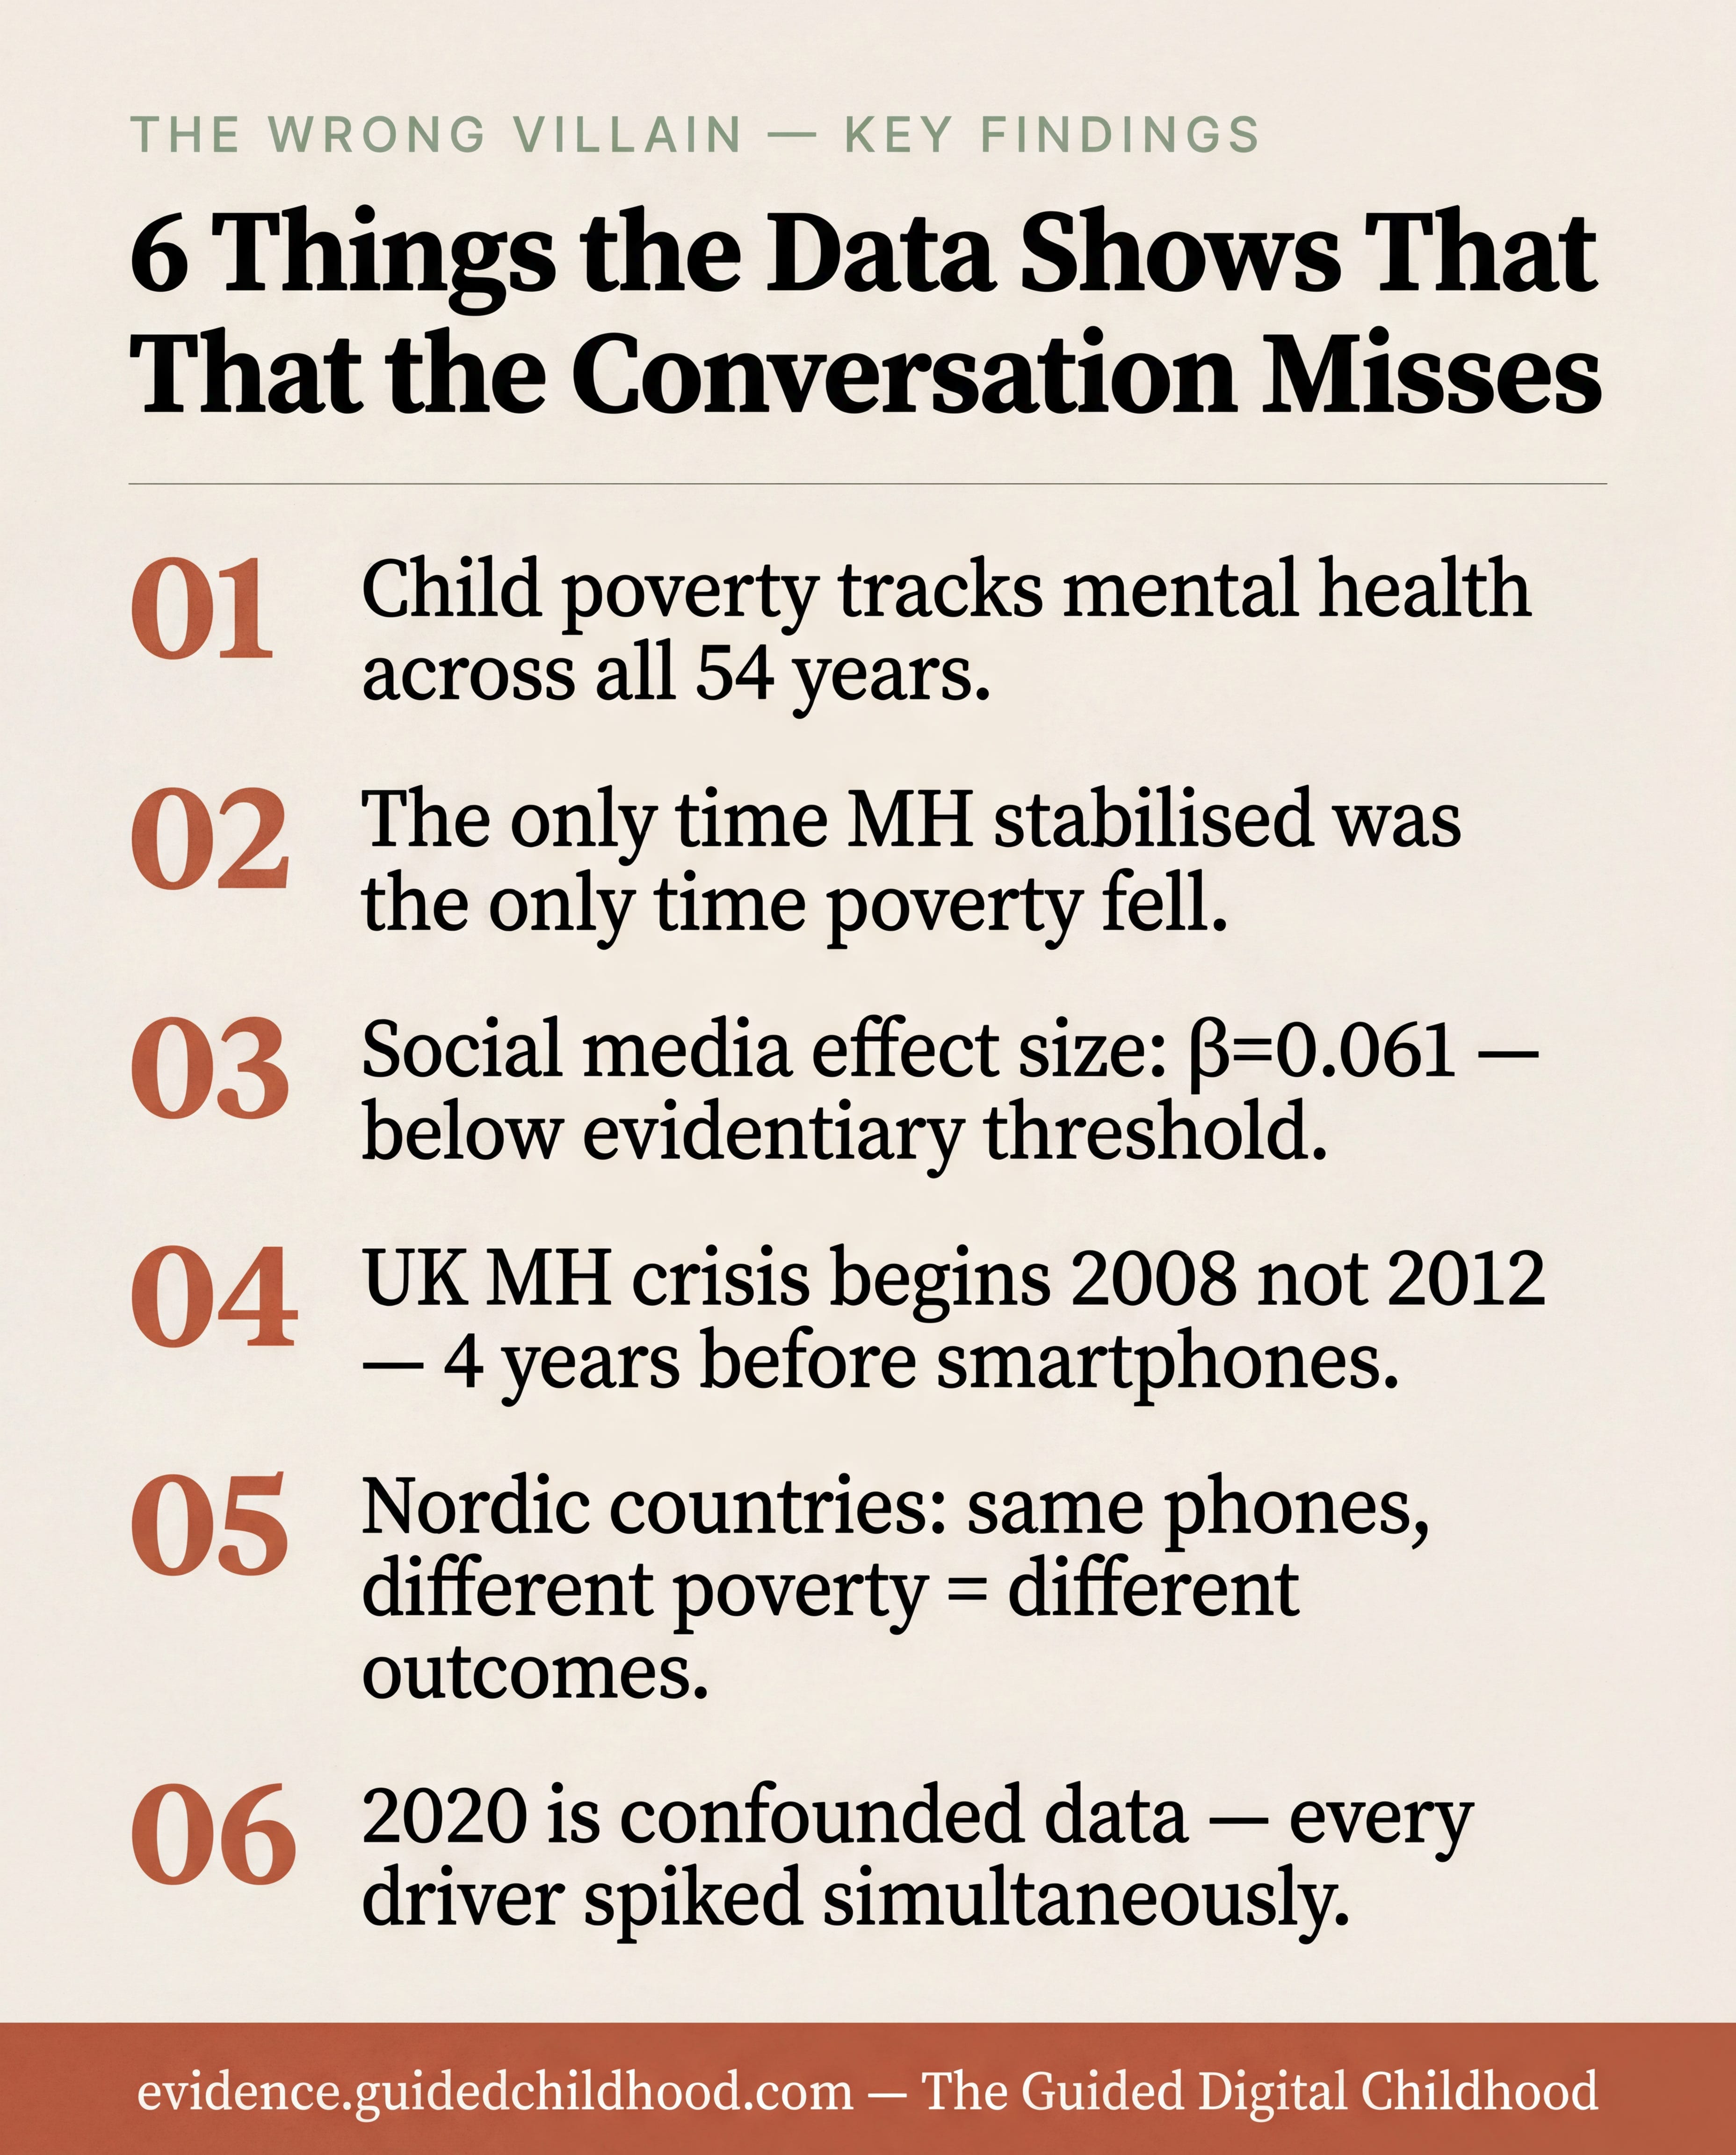
Between 1997 and 2004, child poverty fell from 27% to 21%. That was the Blair government’s child poverty reduction programme. It is the only sustained fall in child poverty in 54 years of data.
During the same period, child mental health disorder prevalence stabilised. It stopped rising. The only time in the entire dataset that it did not rise.
Then the poverty reduction effort plateaued. The poverty line stopped falling and began drifting upward. And the mental health line immediately followed — rising again from around 2004 onward, accelerating sharply after the financial crash in 2008, and then again after austerity began in 2010.
No other variable in the dataset explains both movements simultaneously. The timing is exact. The correlation runs in both directions when poverty went down, mental health stabilised; when poverty went up, mental health deteriorated. This is the most important natural experiment in 54 years of UK data. It is the most powerful single piece of evidence in the entire tool. And it is almost entirely absent from the public conversation about what is driving the crisis.
The social media debate, properly interrogated
Phase 2 of the tool runs Jonathan Haidt’s argument over the same data.
His 2024 book argues that smartphones mass-adopted around 2012 caused the children’s mental health epidemic. The theory is coherent and the correlations he identifies are real. His concern for children is genuine and his work has put this issue on a much wider map. I am not dismissing it.
What Phase 2 does is show his predicted effect as a separate bar running alongside the actual mental health data. His model predicts the mental health line should be essentially flat until 2012, then turn sharply upward as smartphone adoption accelerated.
In UK data, the mental health bar does not change gradient in 2012.
Child mental health prevalence begins accelerating in 2008 the year of the global financial crash four years before Haidt’s claimed pivot point. The poverty line starts rising in 2010. CAMHS budgets begin being cut in 2010. By the time smartphones hit 50% adoption in 2012, every major driver is already in motion. The argument that smartphones caused what was already happening before they were ubiquitous does not survive contact with the UK timeline.
Phase 2 also shows six specific places where Haidt’s argument breaks against this data. Each one is a specific, testable claim against primary source data with the peer-reviewed research cited alongside it.
Phase 3 is what I think of as the honest version of the strongest case for social media’s role. Four points I think are genuinely valid the real correlation in heavy users, the experimental reduction studies, the documented harm of algorithmic amplification of self-harm content, the sleep disruption pathway. And then the two data points the argument still cannot explain.
The first is the Nordic comparison. Sweden, Denmark, and the UK all have comparable smartphone adoption rates. Their mental health trajectories look very different. Sweden has the highest child poverty rate among Nordic countries and shows the steepest mental health deterioration. Denmark has the lowest poverty rate and shows the least. The variable that tracks the differences is not the device. It is the economic conditions children are growing up in.
The second is 2020. The largest single-year mental health deterioration ever recorded happened when children’s social media use increased during lockdown. The same year saw schools closed for 18 months, peer relationships severed during critical developmental windows, family finances collapsing, and parental stress at levels not seen in a generation. You cannot isolate social media as the cause when every other proven driver spiked simultaneously. 2020 is confounded data. It is not evidence for the social media argument but it is not evidence against it either. It is a year where everything went wrong at once, and drawing a single-cause conclusion from it in either direction is a methodological error.
The number that reframes the whole conversation
A peer-reviewed meta-analysis published this year by Ferguson et al. in Professional Psychology looked at 46 studies and 79 effect sizes on social media and adolescent mental health. The pooled result was β = 0.061 — below the threshold the researchers themselves set for evidentiary value, and statistically indistinguishable from noise.
Four independent research groups at UC Irvine under Candice Odgers, at Cambridge MRC under Amy Orben, at Oxford under Andrew Przybylski, and at Stetson University under Christopher Ferguson have all reached essentially the same conclusion from different datasets, different methodologies, and different starting assumptions. The association between social media use and adolescent mental health is real but very small. The causation has not been established. The effect size is comparable, in Orben and Przybylski’s own words, to wearing glasses.
The current evidence puts social media’s contribution to child mental health outcomes at roughly 3%.
Child poverty sits at roughly 32%. Adverse childhood experiences at 24%. Parental mental health difficulties at 14%. System underfunding at 10%. The pandemic at 8%.
If those numbers are even approximately right and they are consistent with the current peer-reviewed evidence base then the response to the children’s mental health crisis is catastrophically misdirected. The 3% problem is consuming the vast majority of public attention, parliamentary time, and policy energy. The 32% problem is chronically underfunded and almost invisible in the mainstream conversation.
What I want to be clear about
I am not here to argue that social media is harmless or that platforms bear no responsibility.
Algorithmic amplification of self-harm and eating disorder content is a documented harm. It is confirmed by the Molly Russell inquest, by Frances Haugen’s testimony before the US Senate, and by Meta’s own internal research. Age verification that doesn’t work is a regulatory failure with real consequences. The design choices that platforms make variable reward loops, infinite scroll, notification systems calibrated to maximise time on platform are applied to developing brains during their most sensitive window. These deserve serious regulatory responses and I will always argue for them.
The argument is about proportion. A child without a phone but without stable housing, a trusted adult, or any route to support is not a safer child.
I am also not here to dismiss researchers who reach different conclusions. Jonathan Haidt, Jean Twenge, and Vivek Murthy have done serious work and care deeply about children. The Surgeon General’s 2023 advisory is frequently cited as proof of consensus but read it. It states explicitly that there is not yet enough evidence to determine if social media use is sufficiently safe. That is an acknowledgement of uncertainty, not a finding of harm. It is precisely the position that Odgers, Orben, and Przybylski have held throughout.
This is a relatively young field. I hold all of this lightly. If new data changes the picture I will update the tool publicly and say so. What I will not do is let the conversation remain disproportionate while the children who need the most help wait the longest.
Why this matters practically
78,000 children waited over a year for mental health treatment in 2023/24. More than 34,000 waited over two years. In a 2022 survey, more than a quarter of children on those waiting lists said they had attempted suicide while waiting for the appointment that hadn’t arrived.
4.5 million children in the UK live in poverty a record high. Children and young people with mental health difficulties go an average of 10 years between becoming unwell and getting help. Ten years of unaddressed need accumulating before treatment begins.
None of these numbers get better because of an app store age limit. The response has to be calibrated to the actual causes. And right now it isn’t.
The tool, the framework, and what comes next
The Wrong Villain data tool is one part of what The Guided Digital Childhood is building.
The broader framework rests on a specific idea: that what a child carries into the digital world matters more than how long they spend there. The platform does not create the vulnerability. It finds what was already there and deepens whatever sustains engagement. Understanding what your specific child carries the adversity, the anxiety, the gaps in connection and support is the starting point for anything that actually helps.
The Guided Digital Pathway and the Social Media History Checker are the practical tools we are building to make that real for families and schools. Not to pathologise children. Not to replace parental judgment. To inform it, with the evidence that actually matters.
The data tool is free. Go to evidence.guidedchildhood.com press Play, and watch 54 years move.
If this changes how you think about what’s driving the crisis, share it with a parent, a teacher, a clinician, or anyone making decisions about children’s services. The more people working from the right map, the better the chance of a response that actually reaches the children who need it most.
The Guided Digital Childhood publishes every Sunday. If you want to go deeper on what the pathway framework means practically what it looks like for your child, your school, your service Subscribe below.